I recently wrote an article about the best hidden features of the AdWords Editor. In this post, I have collected seven Google Analytics features that have surprised either myself, colleagues or clients upon discovery despite being deemed elementary features to others. Perhaps some of them are also unknown to you.
1. Plotting Individual Rows
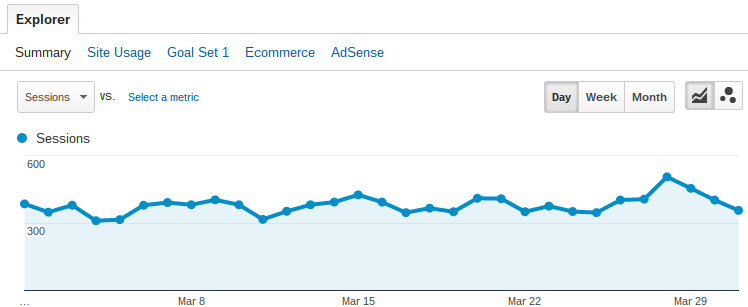
One of the most recognizable elements of Google Analytics is probably the graph shown at the top of almost every report.
 Individual Rows in Google Analytics
There is a simple yet handy feature called “Plot Rows” which quite a few Analytics users do not seem to be familiar with.
If you check at least one of the little boxes on the left side of the table below the chart, you can click the “Plot Rows” button found right above the table.
 Plotting Rows in Google Analytics
The selected rows will now be plotted as individual graphs, and you can easily see changes in values over time for each of these rows.
 Changes Over Time in Plotted Rows in Google Analytics
How Are Plotted Rows in Google Analytics Useful?
Assume you have recently seen a sudden drop in the organic traffic to your site. One possible explanation could be that you recently started bidding on your brand name with AdWords. By plotting the rows of paid and organic Google traffic, you can easily tell if the decline in organic traffic is coinciding with an increase in the paid traffic.
 Decline in Organic Traffic; Increase in Paid Traffic
2. Customize the Existing Standard Reports
Google Analytics offers an extensive range of standard reports which can be accessed in just a few clicks. But sometimes you will find there is just one single metric missing from the report.
Instead of creating a new custom report from scratch, there is a neat little shortcut that lets you base a new report on one of the existing standard reports.
All you have to do is click the little “Customize” button at the top of the report you want to build upon.
 Customize Standard Reports in Google Analytics
This will bring you to the “Create Custom Report” page but with all the existing metrics and dimensions already filled out for you. Now you can quickly alter it to fit your needs by adding the metrics you were missing.
 Customized Reports in Google Analytics
3. Create Your Own “Calculated Metrics”
In the fall of 2015, Google introduced Calculated Metrics to Google Analytics. Calculated Metrics lets you create new metrics based on the existing set of metrics. These calculated metrics can then be used within custom reports, dashboards or widgets.
You will find it by going to “Admin” and choose “Calculated Metrics” from the “View” column.
 Calculated Metrics in Google Analytics
Here you get to create new calculated metrics. After giving your metric a name (you can ignore “External name”) and choosing between the five formatting types (Integer, Currency, Time, Float, Percentage), you just start by typing the name of the first metric you want in the Formula field.
After choosing a metric, you type in an operator (plus, minus, divided by, or multiplied by), and finally you type in another metric or a number.
Below is an example of a simple Calculated Metric using the Revenue metric to calculate the profit.
 Calculating Revenue in Google Analytics
After saving your new Calculated Metric, you will be able to use it when creating custom reports or dashboards.
 Applying Your Calculated Metric in Google Analytics
For more on Calculated Metrics, I recommend this blog post by Avinash Kaushik in which he describes five useful Calculated Metrics.
4. Intelligent Sorting With ‘Weighted Sort’
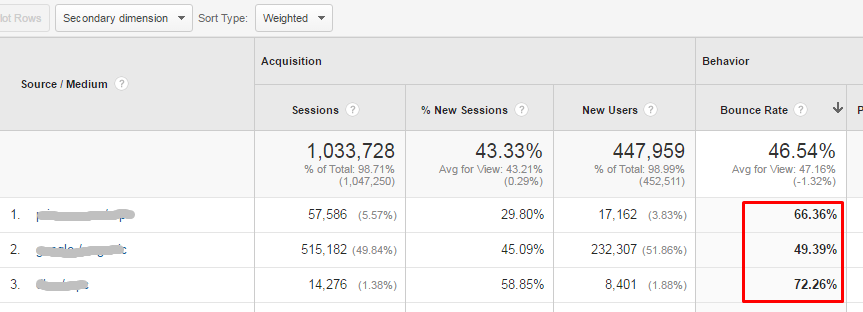
If you have ever sorted a report by bounce rate and seen nothing but entries with a 100% bounce rate, you may have noticed all of these entries only have one visit. This is not helpful since improving the bounce rates of these entries wouldn’t have a huge overall impact on the performance of your site.
 Weighted Sort in GA
Luckily, Google introduced a new sorting algorithm called “ Weighted Sort” back in 2010.
Weighted Sort takes into consideration the number of visits for each row and thereby shows the items you should care about. To activate it you need to sort the table by bounce rate (or another metric using percentages) and choose “Weighted” in the drop down next to “Sort Type.”
 Choose Weighted Sort Type
This will give you a report you can actually make use of as these top rows are probably going to have the highest possible impact on your business.
 High-Impact Data in Google Analytics
For more on Weighted Sorting and how it is computed, you should check out this post by Avinash Kaushik.
5. Control the Number of Sessions Used to Calculate Reports
You may have noticed a yellow notification in the upper right corner saying “This report is based on X sessions …” This notification is shown when Google Analytics is sampling your data due to high volume.
Sampling in Google Analytics occurs automatically when more than 500,000 sessions are collected for a report. This allows Google Analytics to generate reports more quickly for those large data sets. It will often occur when you apply segments or secondary dimensions to standard reports or when creating custom reports.
 Google Analytics: Adjust Sessions Used to Calculate Reports
When you view a sampled report, you can adjust the sampling size for either faster response and less precision or slower response but greater precision. You just have to click the icon with the small squares and then move the slider.
 How to Adjust Sessions
If you set it to higher precision, Google Analytics will use a larger sample size, but the increased precision comes at the cost of a slower loading time.
 Get a Slower Loading Time in GA Reports
6. Define Your Own Custom Channels
Okay, so you already knew about the five previous features. What about Channel Groupings?
Channels Groupings is a feature I rarely see people use, but it is something I find useful when reporting to clients. You are probably familiar with the standard “Channels” report which shows how your traffic is distributed across Google Analytics’ default channels like “Organic Search,” “Direct,” “Social” and so on.
 Define Custom Channels in Google Analytics
But did you know you can also define your very own channels? You just need to go to “Admin” and choose “Channel Settings” and then “Channel Grouping.”
 Select Channel Grouping in GA
Start by clicking the “New Channel Grouping” button. After you have named your new Channel Grouping, you get to define your channels. It’s completely up to you to decide which channels you want to create and how you are going to define each of them.
Below is an example of some of the channels I have defined for a client.
 Channel Setup in Google Analytics
It’s especially useful for cleaning up the source mess caused by the referral traffic from Facebook.
 Use Channel Groupings to Sort Facebook Traffic
By defining a custom channel for Facebook in your Channel Grouping, you can combine all the different Facebook referrals into one single channel.
 Combine Facebook Groupings into One Single Channel in Google Analytics
To access your finished Channel Grouping go the “Channels” report. Click “Default Channel Grouping.” Now choose your new grouping from the dropdown.
 Choose Channel From Dropdown
Now you get to view your new custom channels in a report like the one below. I find this tailored report to be much appreciated by clients who just want an uncluttered overview of the channels they operate with.
 Channel Overviews Help Clients
7. Select Entire Months With One Click
I want to finish this post with a simple yet nice little feature from the date range selector. It’s nothing fancy, but I’ve seen some very surprised faces from even regular Google Analytics users when they first learned about it.
When choosing a date range in the upper right corner, you can just click the name of the month if you want to select the whole month! No need to select the first day and last day. Just click the name of the month.
 Select an Entire Month
Annoyingly, Google has yet to bring this little shortcut to the date range selector of the AdWords interface!